Overall Stock Market: S&P 500 (SPY ETF)
Let’s take a look at what the overall market has done since February of this year. I will use SPY, the ETF that tracks the S&P 500 Index.
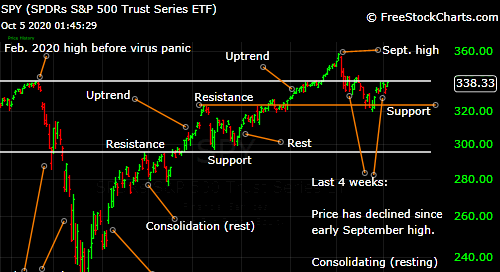
Here is a daily chart of SPY since February:

When the corona virus panic hit, the market dropped 35% from its February high. Then it started a historic uptrend that saw prices recover and surpass the February high in early September. Since early September, SPY declined 10% before gaining 5% in the last 2 weeks.
Today, let’s focus on the concept of trend/consolidation. Another concept we should learn is support/resistance.
Let’s start with trend/consolidation.
Even during the strongest uptrend, prices don’t go straight up. From the March 23 bottom to the September 2 high, SPY gained around 63%. But even during this rocket-ship rally, prices did not go straight up. Remember, every red bar you see on the chart is a day when prices declined. You can see that there were quite a few days when prices dropped, and some periods that lasted from several days to several weeks saw prices go sideways at best or decline 5 or 10% at worst.
These periods of sideways/declining price action during a trend are called consolidations. A consolidation is when prices consolidate the gains before starting another uptrend.
Or not.
There is no rule that says an uptrend must continue. A stock can gain 50% in 3 months and crash 80% in the next week.
But, perhaps more often than not, a stock in a uptrend or downtrend will periodically “consolidate” before continuing the previous trend.
Nobody knows if the previous trend will continue.
A trader can only pick an advantageous price to enter a trade if he decides to trade. Remember that: you don’t have to trade! Sitting out is often the best thing to do. But doing nothing is difficult because traders are humans and humans are, well, greedy and impatient.
The other topic is Support and Resistance. You can see that previous areas of Support often act as areas of Resistance.
Support is a price level where prices stabilize or hold and reverse the previous trend. Or, again, continue the previous trend. But even merely pausing at a particular price level means that that level provided some “support,” and this support becomes “resistance” when days, weeks, months, or even years later prices have a difficult time or at least pause when it reaches this previous level of support.
Prices will either consolidate below the resistance level before punching through or it will be turned back and decline. Of course, prices can make another attempt to overcome resistance later.
You can be a good trader applying just these two principles: trend/consolidation and support/resistance.
The difficulty, as always, is controlling our emotions.
Periods of consolidation can last days, weeks, months, and years. Few people can stay patient and not put their money at risk until the next trend starts.
Back to SPY: since early September, has SPY been consolidating its gains and getting ready to start another uptrend?
You know the answer: I don’t know, and nobody does either
Only thing you can do is pick an advantageous spot to enter a trade—if you decide to trade.
We’ll discuss possible entry and exit points soon. Until then, take care.
Note: If you want to learn more about chart patterns in addition to reading about them in this newsletter, check out my book Trading Stocks Using Classical Chart Patterns ( available on Amazon). I’m very proud of this book as I think it is a thorough and clear introduction to chart trading. The book also discusses specific entry and exit points for dozens and dozens of chart patterns.
Disclosure: I own shares of SPY.
Disclaimer: Everything in this newsletter is for informational and entertainment purposes only and is not to be considered professional advice of any kind. All statements and opinions in this book are not meant to be a solicitation or recommendation to buy, sell, or hold securities. Trading stocks and investing involve risk and may result in financial loss. All trading and investment decision you make are your own.


